Captures
The corpus is coloured ANSI-SGR mixed with Chinese, Korean and ASCII, written to the session’s TTY by the benchmark script — no need to touch the phone.
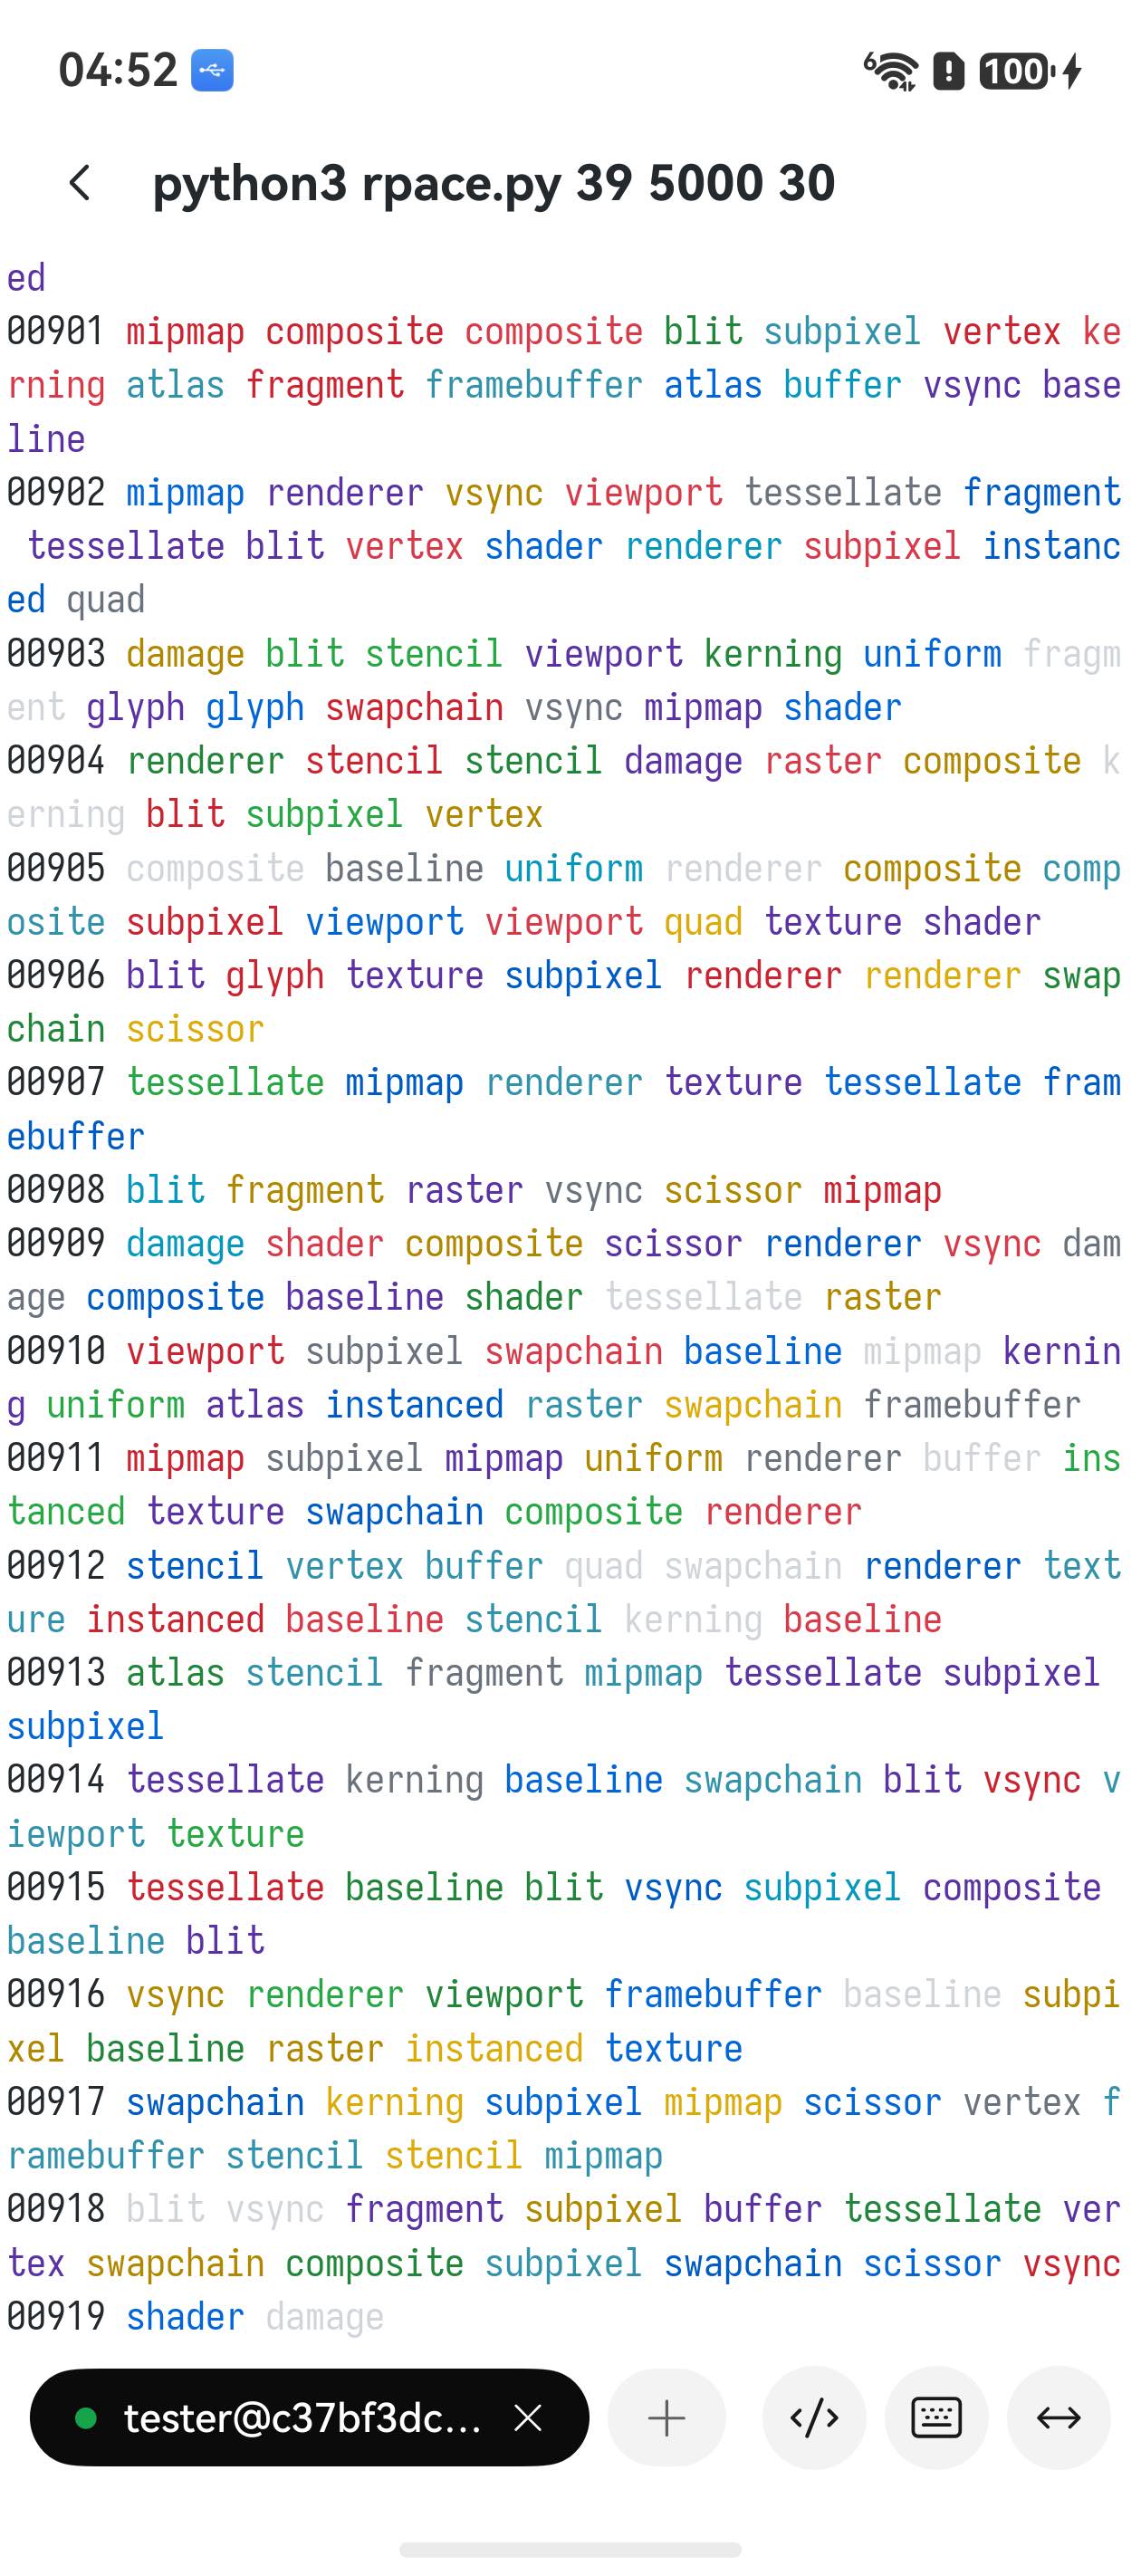
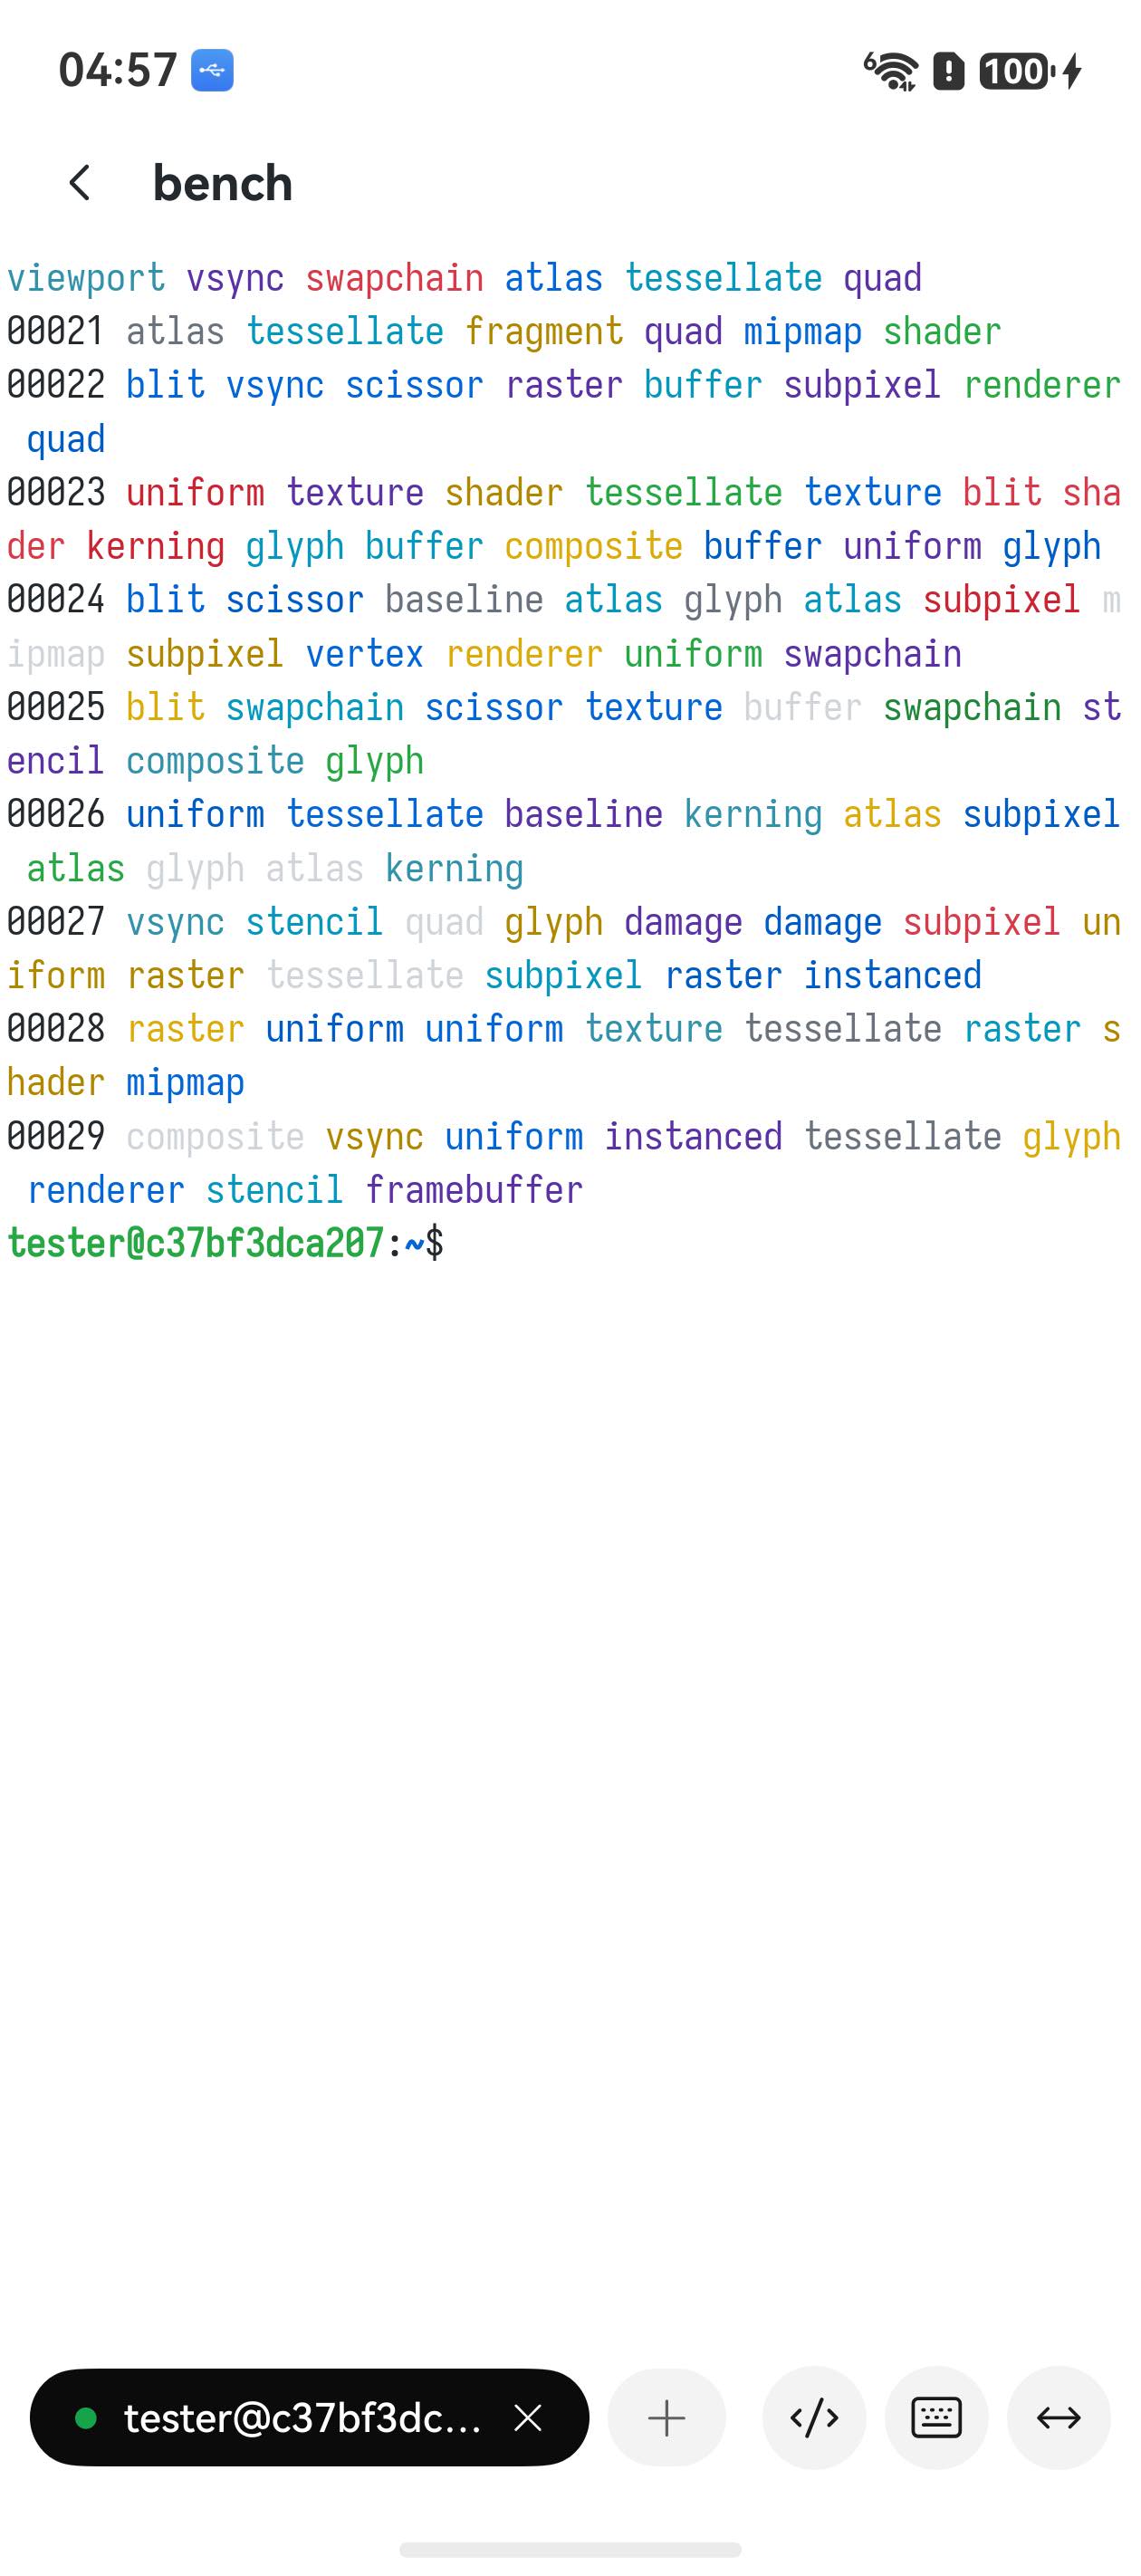
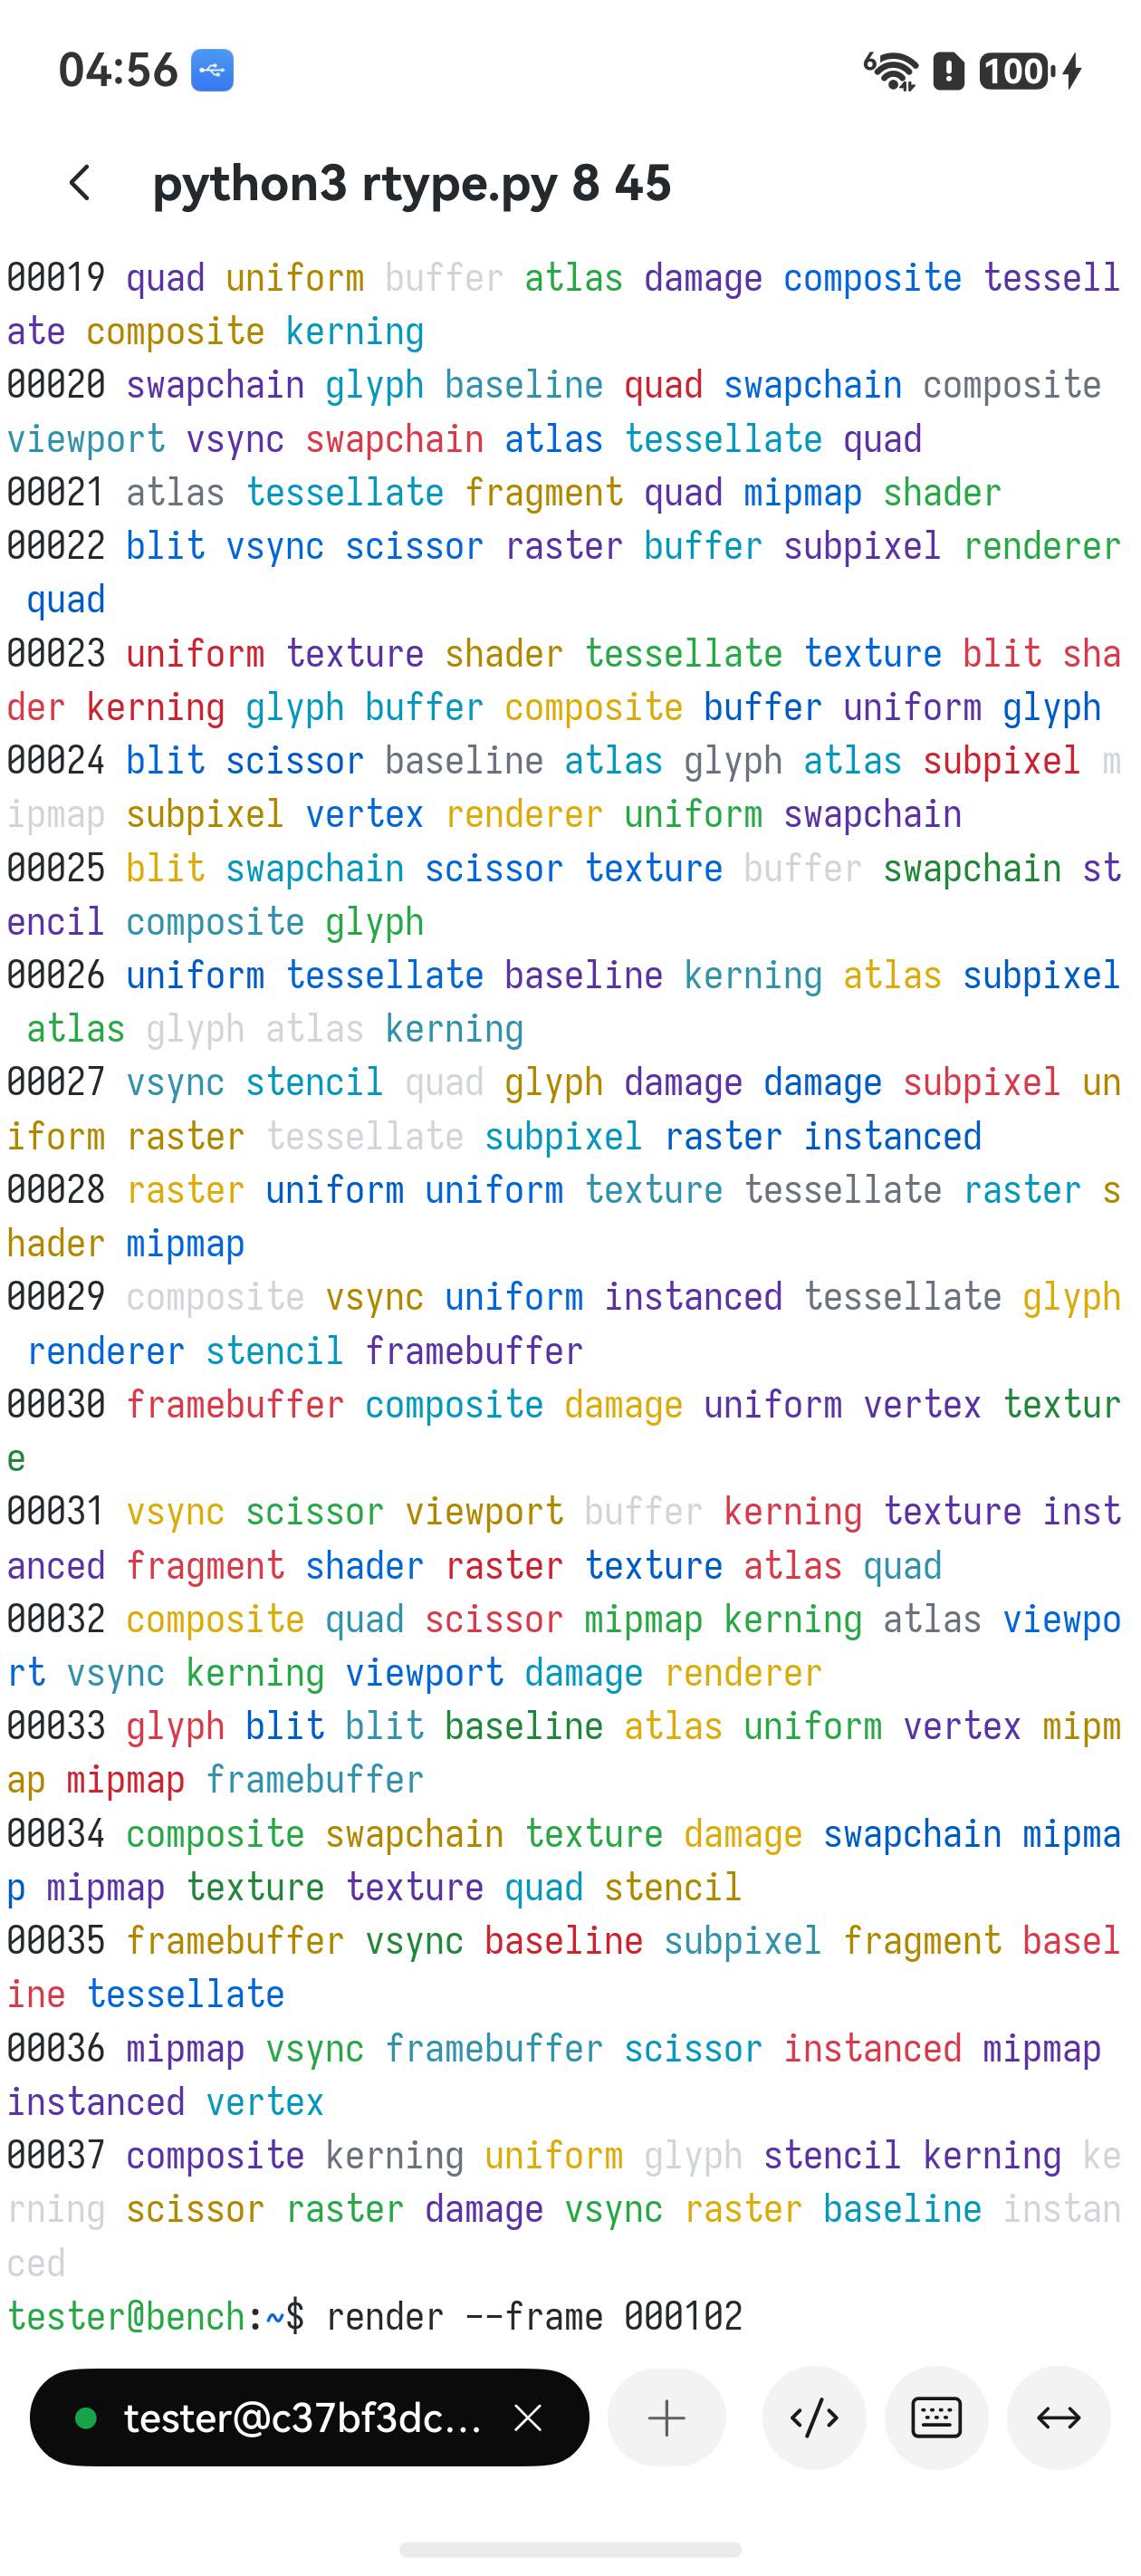
Term’s terminal rendering moved to an EGL/GLES3 instanced renderer — here is the method, the data and the captures, measured on real hardware.
Written · Updated
Two measurements, one corpus, both through the built-in Log frame stats developer switch. The CPU column is the 2026-07 baseline on a Pura 70, kept because the CPU path no longer exists to re-measure; the GPU column is a fresh 2026-08 run on an HBN-AL80. Different phones, so read the speed-up as the order of the win rather than a figure to two decimal places.
| Workload | CPU path | GPU path | Speed-up |
|---|---|---|---|
| Full-screen scroll (firehose) | 14.6 ms · 68 fps | 4.26 ms · 235 fps | 3.4× |
| Slow scroll (~5 rows/frame) | 12.8 ms · 76 fps | 5.05 ms · 198 fps | 2.5× |
GPU frame time is almost independent of how much scrolled — every frame is a full redraw, and that is cheap for a GPU. The CPU path’s sensitivity to the number of scrolled rows simply disappears.
About 1400 instanced quads per frame. Glyphs are rasterised into a texture atlas once, and every later frame only re-emits mesh instances.
| Stage | Average | What it does |
|---|---|---|
| build | 1.82 ms | CPU side: walk the grid → instance quads + rasterise new glyphs into the atlas + upload |
| draw | 0.35 ms | GL instanced draw |
| swap | 2.08 ms | eglSwapBuffers (present) |
| Frame total | 4.26 ms | ≈ 235 fps |
Two 14 MB memory shuffles are gone: no more scroll-shifting the shadow bitmap (~6 ms) and no more copy into the dmabuf (~5.6 ms) — that ~11 ms is the entire saving. The GPU rasterises in place, straight onto the EGL surface.
The corpus is coloured ANSI-SGR mixed with Chinese, Korean and ASCII, written to the session’s TTY by the benchmark script — no need to touch the phone.
The script automates all three phases (firehose scroll / idle blink / single-row update) by writing to the TTY of a session on the remote host — zero interaction on the phone.
#!/bin/bash
T="${1:-/dev/ttys000}"

# corpus: coloured ANSI-SGR + Chinese/Korean/ASCII, 400 rows
corpus() {
  i=0
  while [ $i -lt 400 ]; do
    printf "\033[3%dm%04d 端末描画性能測定 中文渲染基准 가나다라마 \033[1mBOLD\033[0m ascii-abcdefghijklmnop %05d\n" \
      $((i % 8)) $i $((i * 37))
    i=$((i + 1))
  done
}
C="$(corpus)"

# P1 firehose scroll, 30s (full frames, total damage)
printf "\n\033[36m=== GPUBENCH P1: firehose scroll 30s ===\033[0m\n" > "$T"
end=$((SECONDS + 30))
while [ $SECONDS -lt $end ]; do printf "%s\n" "$C" > "$T"; done

# P2 idle, 60s (blink only → partial presentation frames)
printf "\n\033[36m=== GPUBENCH P2: idle (blink only) 60s ===\033[0m\n" > "$T"
sleep 60

# P3 single-row update, 20s (~8 Hz, typing-shaped partial frames)
printf "\n\033[36m=== GPUBENCH P3: single-row updates 20s ===\033[0m\n" > "$T"
end=$((SECONDS + 20))
n=0
while [ $SECONDS -lt $end ]; do
  printf "\rtyping simulation %06d" $n > "$T"
  n=$((n + 1))
  sleep 0.12
done
printf "\n\033[36m=== GPUBENCH done ===\033[0m\n" > "$T"
gpubench.sh there and find the session’s TTY with who -u../gpubench.sh /dev/ttysNNN (the session’s tty).hdc -t <target> shell hilog | grep "connrender: gpu" — one stats window every 60 frames.Two things decide whether a run means anything. Pace the feed. A plain cat is not a sustained load — 200 000 lines / 28 MB was consumed in under a second here, and every window after that is an idle cursor blink at 2 fps; read those as “the renderer only manages 2 fps” and you have measured nothing. Offer a known rate instead and hold it. Watch the clocks. The same screen costs ~11 ms/frame when painted twice a second and ~4.3 ms under sustained load — 2.5×, purely DVFS. That 11 ms is the honest number for the first frame after a pause; the 4.3 ms is the honest number under load. Never compare across the two. Also keep the soft keyboard down: it halves the grid to 56×19 and flatters everything.